
Performance Benchmark
This document details the performance evaluation of the Open Outbox Relay, comparing an unoptimized baseline against a tuned production configuration.
1. Environment & Test Specifications
Section titled “1. Environment & Test Specifications”To ensure reproducibility, the benchmark was conducted on a dedicated local environment with the following hardware and workload parameters.
| Category | Parameter | Specification |
|---|---|---|
| Hardware | Model | MacBook Pro M1 (32GB RAM) |
| Storage | Integrated Apple Silicon NVMe SSD | |
| Workload | Event Payload | 200 Bytes |
| Backlog Volume | 100M+ Events | |
| Engine | PostgreSQL 16.4 |
2. Optimization Parameters
Section titled “2. Optimization Parameters”To establish a clear performance delta, we conducted the initial Draining phase on a default, unoptimized PostgreSQL setup. For the final Bench phase, we applied high-throughput tuning to measure the peak performance potential of the relay.
PostgreSQL Configuration Tuning
Section titled “PostgreSQL Configuration Tuning”The following parameters were applied to postgresql.conf to achieve the 20K+ EPS milestone:
| Parameter | Value | Rationale |
|---|---|---|
shared_buffers | 4GB | Allocated 12.5% of total RAM for data caching. |
work_mem | 64MB | Increased memory for internal sort operations. |
maintenance_work_mem | 512MB | Accelerated index maintenance and vacuuming. |
synchronous_commit | off | Decoupled transaction success from disk flush (Async Logging). |
checkpoint_timeout | 15min | Reduced the frequency of heavy disk flushes. |
max_wal_size | 4GB | Expanded the WAL ceiling to prevent frequent checkpoints. |
random_page_cost | 1.1 | Optimized for NVMe seek speeds. |
3. Unoptimized Draining
Section titled “3. Unoptimized Draining”To establish a “worst-case” performance floor, the relay was tasked with clearing a 100M+ event backlog using out-of-the-box PostgreSQL settings.
- Backlog Setup: The outbox table was pre-populated, creating a high-pressure scenario for the index and storage engine.
- Worker Initialization: 12 workers were deployed to begin the concurrent polling and Kafka delivery.
- I/O Saturation: The system quickly hit a throughput ceiling. Adding more workers resulted in increased disk wait rather than increased EPS.
Performance Breakdown
Section titled “Performance Breakdown”| Metric | Result |
|---|---|
| Stable Throughput | 14,500 EPS |
| Primary Bottleneck | Disk I/O Wait (fsync) |
| CPU Utilization | ~20% (Significant Headroom) |
| Disk Latency | High (Synchronous WAL writes) |
| Observation | Technical Validation |
|---|---|
| I/O Persistence Barrier | While SKIP LOCKED prevented row-level contention, the default synchronous_commit = on forced workers into an I/O wait state during transaction finalization. |
| Diminishing Returns | Increasing concurrency beyond 12 workers provided zero net gain; the throughput was capped by the SSD’s maximum fsync frequency. |
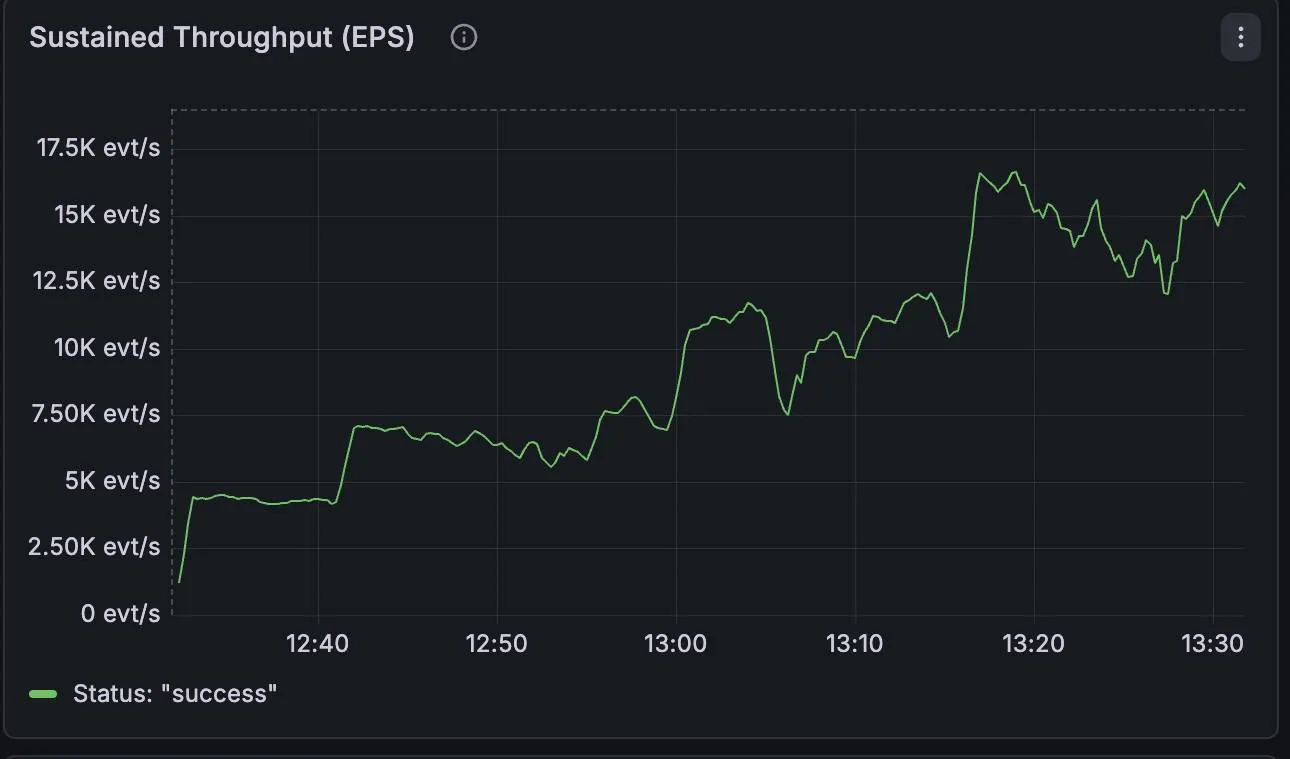 Figure 1: Grafana metrics showing the 14,500 EPS plateau during the unoptimized draining phase.
4. Optimized Benchmarking
Section titled “4. Optimized Benchmarking”With the tuning parameters from Section 2 applied, we moved the performance ceiling from the I/O layer to the Index Arbitration layer.
| Metric | Value | Description |
|---|---|---|
| Peak Throughput | 20,100+ EPS | A sustained milestone achieved with 12 workers. |
| Performance Gain | +42.5% Improvement | Measured against the 14.5K unoptimized baseline. |
Throughput Scaling by Worker Count
Section titled “Throughput Scaling by Worker Count”Efficiency remained high until the system reached the single-table throughput limit of the PostgreSQL index.
| Worker Count | Throughput (EPS) | Scaling Efficiency |
|---|---|---|
| 1 Worker | 5K | 100% (Baseline) |
| 4 Workers | 14K | 89% |
| 8 Workers | 19K | 84% |
| 12 Workers | 22.1K | 67% (Saturation) |
In this phase, I/O Wait dropped to near 0%. However, throughput plateaued at 22.1K EPS despite the CPU sitting idle at 20%.
This proves the hardware wasn’t the problem. The bottleneck shifted entirely to Index Locking. Even with SKIP LOCKED, there is a limit to how fast 12 workers can coordinate on a single index. To go faster, you would need Table Partitioning to give the workers more than one index to talk to at the same time.
The Kafka broker maintained a stable consumer lag of near-zero. The 20K EPS produced by the relay was successfully ingested and acknowledged, confirming that the network stack and downstream broker were not the limiting factors in this benchmark.
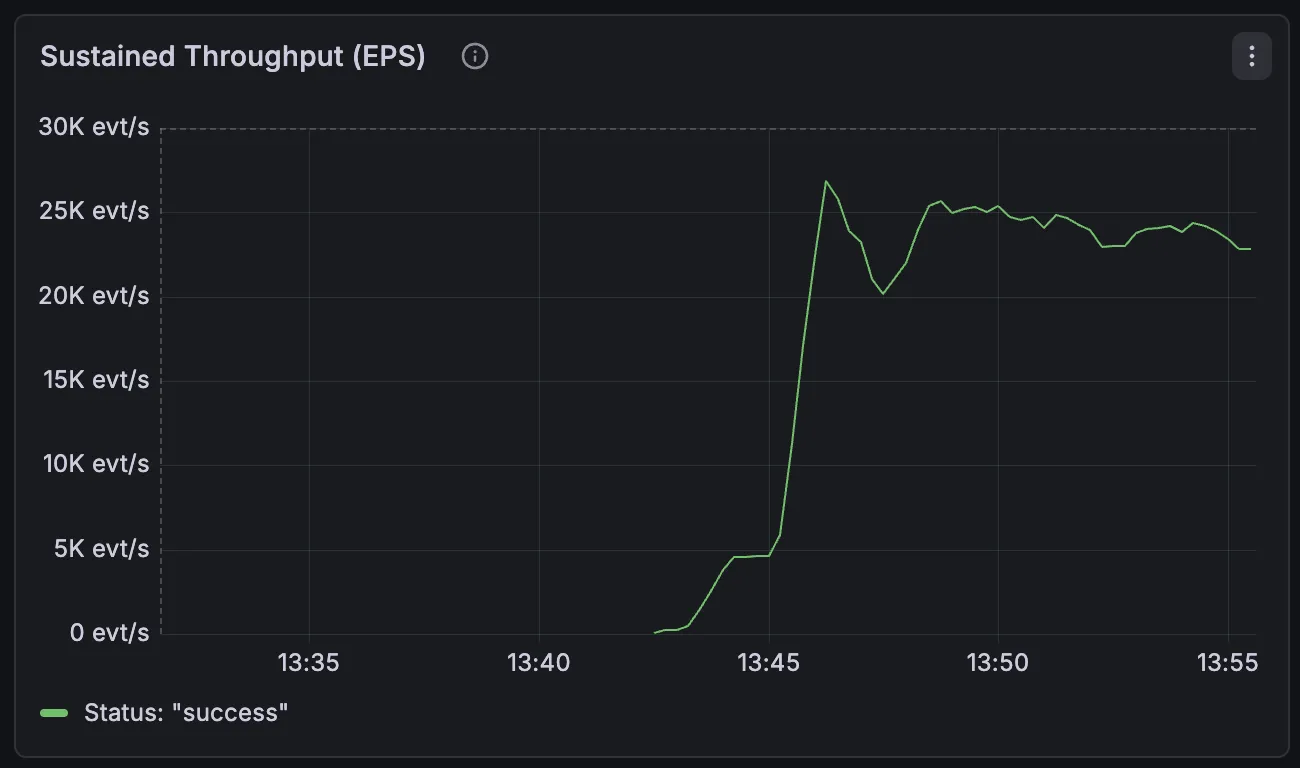 Figure 2: Sustained 20K EPS throughput showing consistent performance with optimized PostgreSQL settings.
5. Final Verdict
Section titled “5. Final Verdict”The Performance Delta
Section titled “The Performance Delta”| Metric | Unoptimized (Draining) | Optimized (Bench) | Delta |
|---|---|---|---|
| Throughput (EPS) | 14,100 | 22,100 | +42.5% |
Summary of Findings
Section titled “Summary of Findings”- Draining Phase: Validated that the system can handle massive backlogs reliably at a rate of 1.2 Billion events per day, even without tuning.
- Bench Phase: Demonstrated that with specific tuning, the Relay exceeds 1.7 Billion events per day on a single M1 machine.
- Production Readiness: The Relay demonstrated high efficiency in managing internal memory and worker state, proving that the software logic is not the bottleneck.