Quick Start
The Open Outbox Relay is a high-performance bridge that ensures “at-least-once” delivery of events from your database to your message broker.
Live Demo
Section titled “Live Demo”The fastest way to see the Relay in action is our pre-configured demo environment. It spins up Postgres, NATS, and the Relay automatically.
-
Start the core services:
Terminal window git clone https://github.com/open-outbox/relay.gitcd relay/examples/demodocker compose up -d -
Choose your ingestion workload:
Trigger the benchmarking profile to stream events continuously into the engine using our optimized load generator. Keep this terminal window open!
Terminal window docker compose --profile load up producerInsert a single transaction record directly into the Postgres outbox table to verify the plumbing.
Terminal window docker compose exec postgres psql -U postgres -d postgres -c \"INSERT INTO openoutbox_events (event_id, event_type, payload, partition_key)VALUES (gen_random_uuid(), 'openoutbox.events.demo', '{\"id\": 123, \"name\": \"Alice\"}', '123');" -
Check Relay Throughput:
Open a separate terminal window and follow the Relay logs to watch it claim and deliver batches of events continuously to NATS:
Terminal window docker compose logs -f relay -
Stop the producer simulation:
Whenever you are ready to pause the active traffic generation, switch back to your producer window and press
Ctrl+C.
Observability & Telemetry
Section titled “Observability & Telemetry”Open Outbox Relay exposes robust OpenTelemetry trace spans and Prometheus metrics. Spin up the visual telemetry suite to inspect performance metrics and execution paths live.
1. Spin up the Telemetry Stack
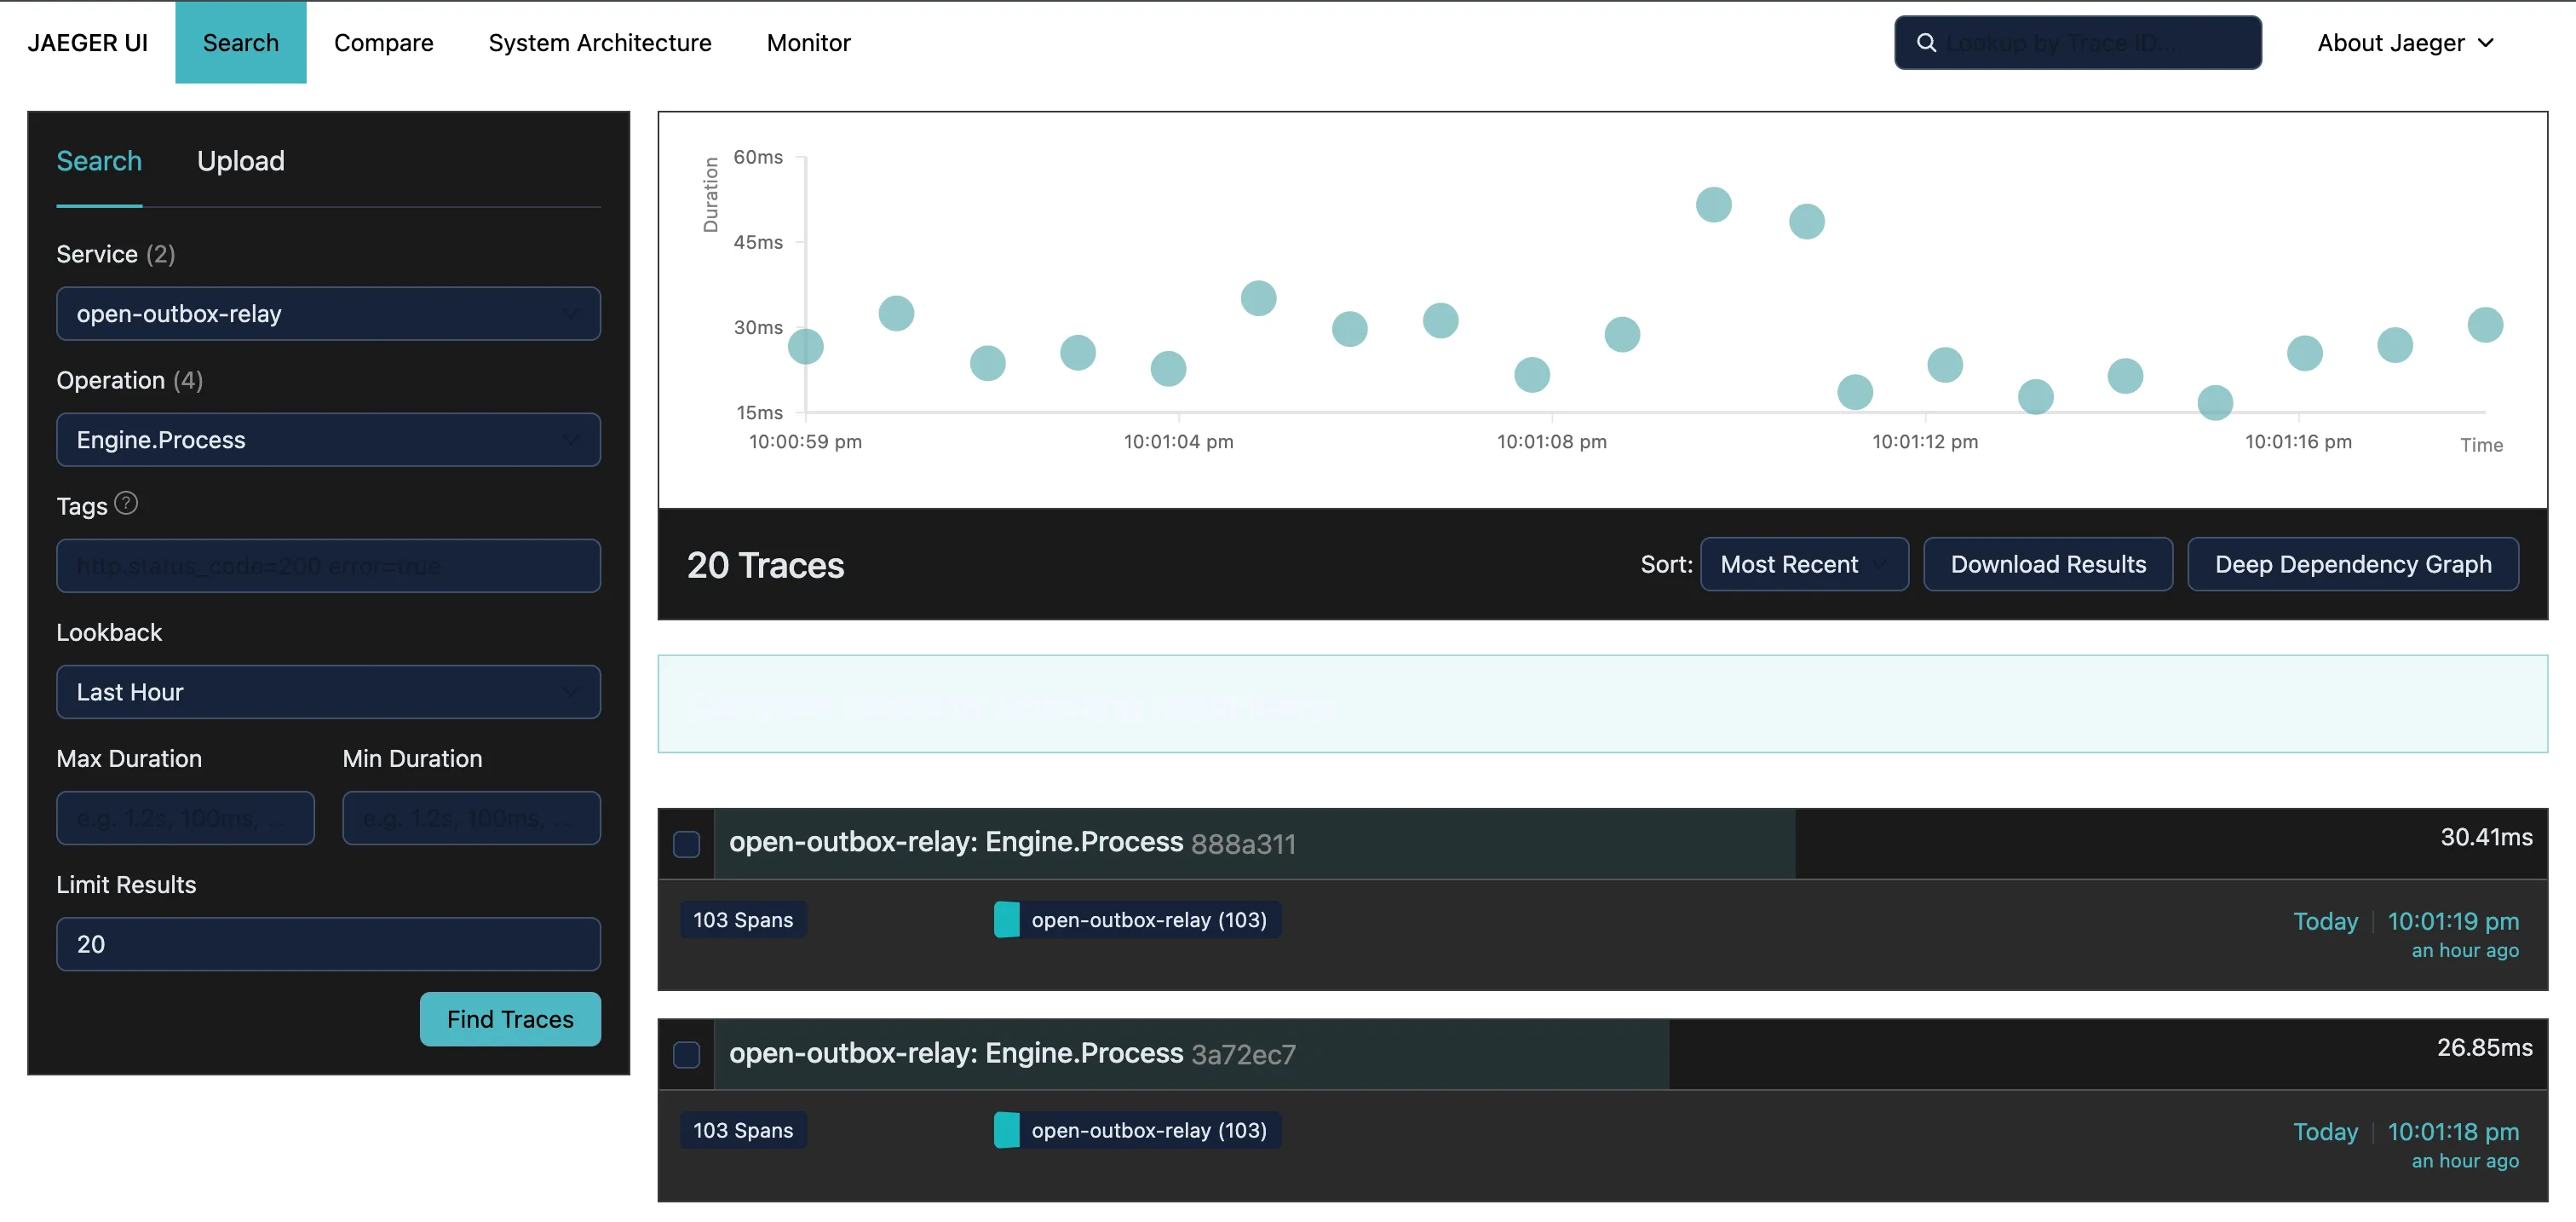
Section titled “1. Spin up the Telemetry Stack”docker compose --profile telemetry up -d2. Visualize Traces (Jaeger)
Section titled “2. Visualize Traces (Jaeger)”- Open http://localhost:16686 in your browser.
- Select Service:
openoutbox-relay - Select an operation (e.g.,
Engine.Process) and click Find Traces.
This layout displays exactly how long each phase—Database Claiming versus Broker Publishing—takes for every batch cycle.
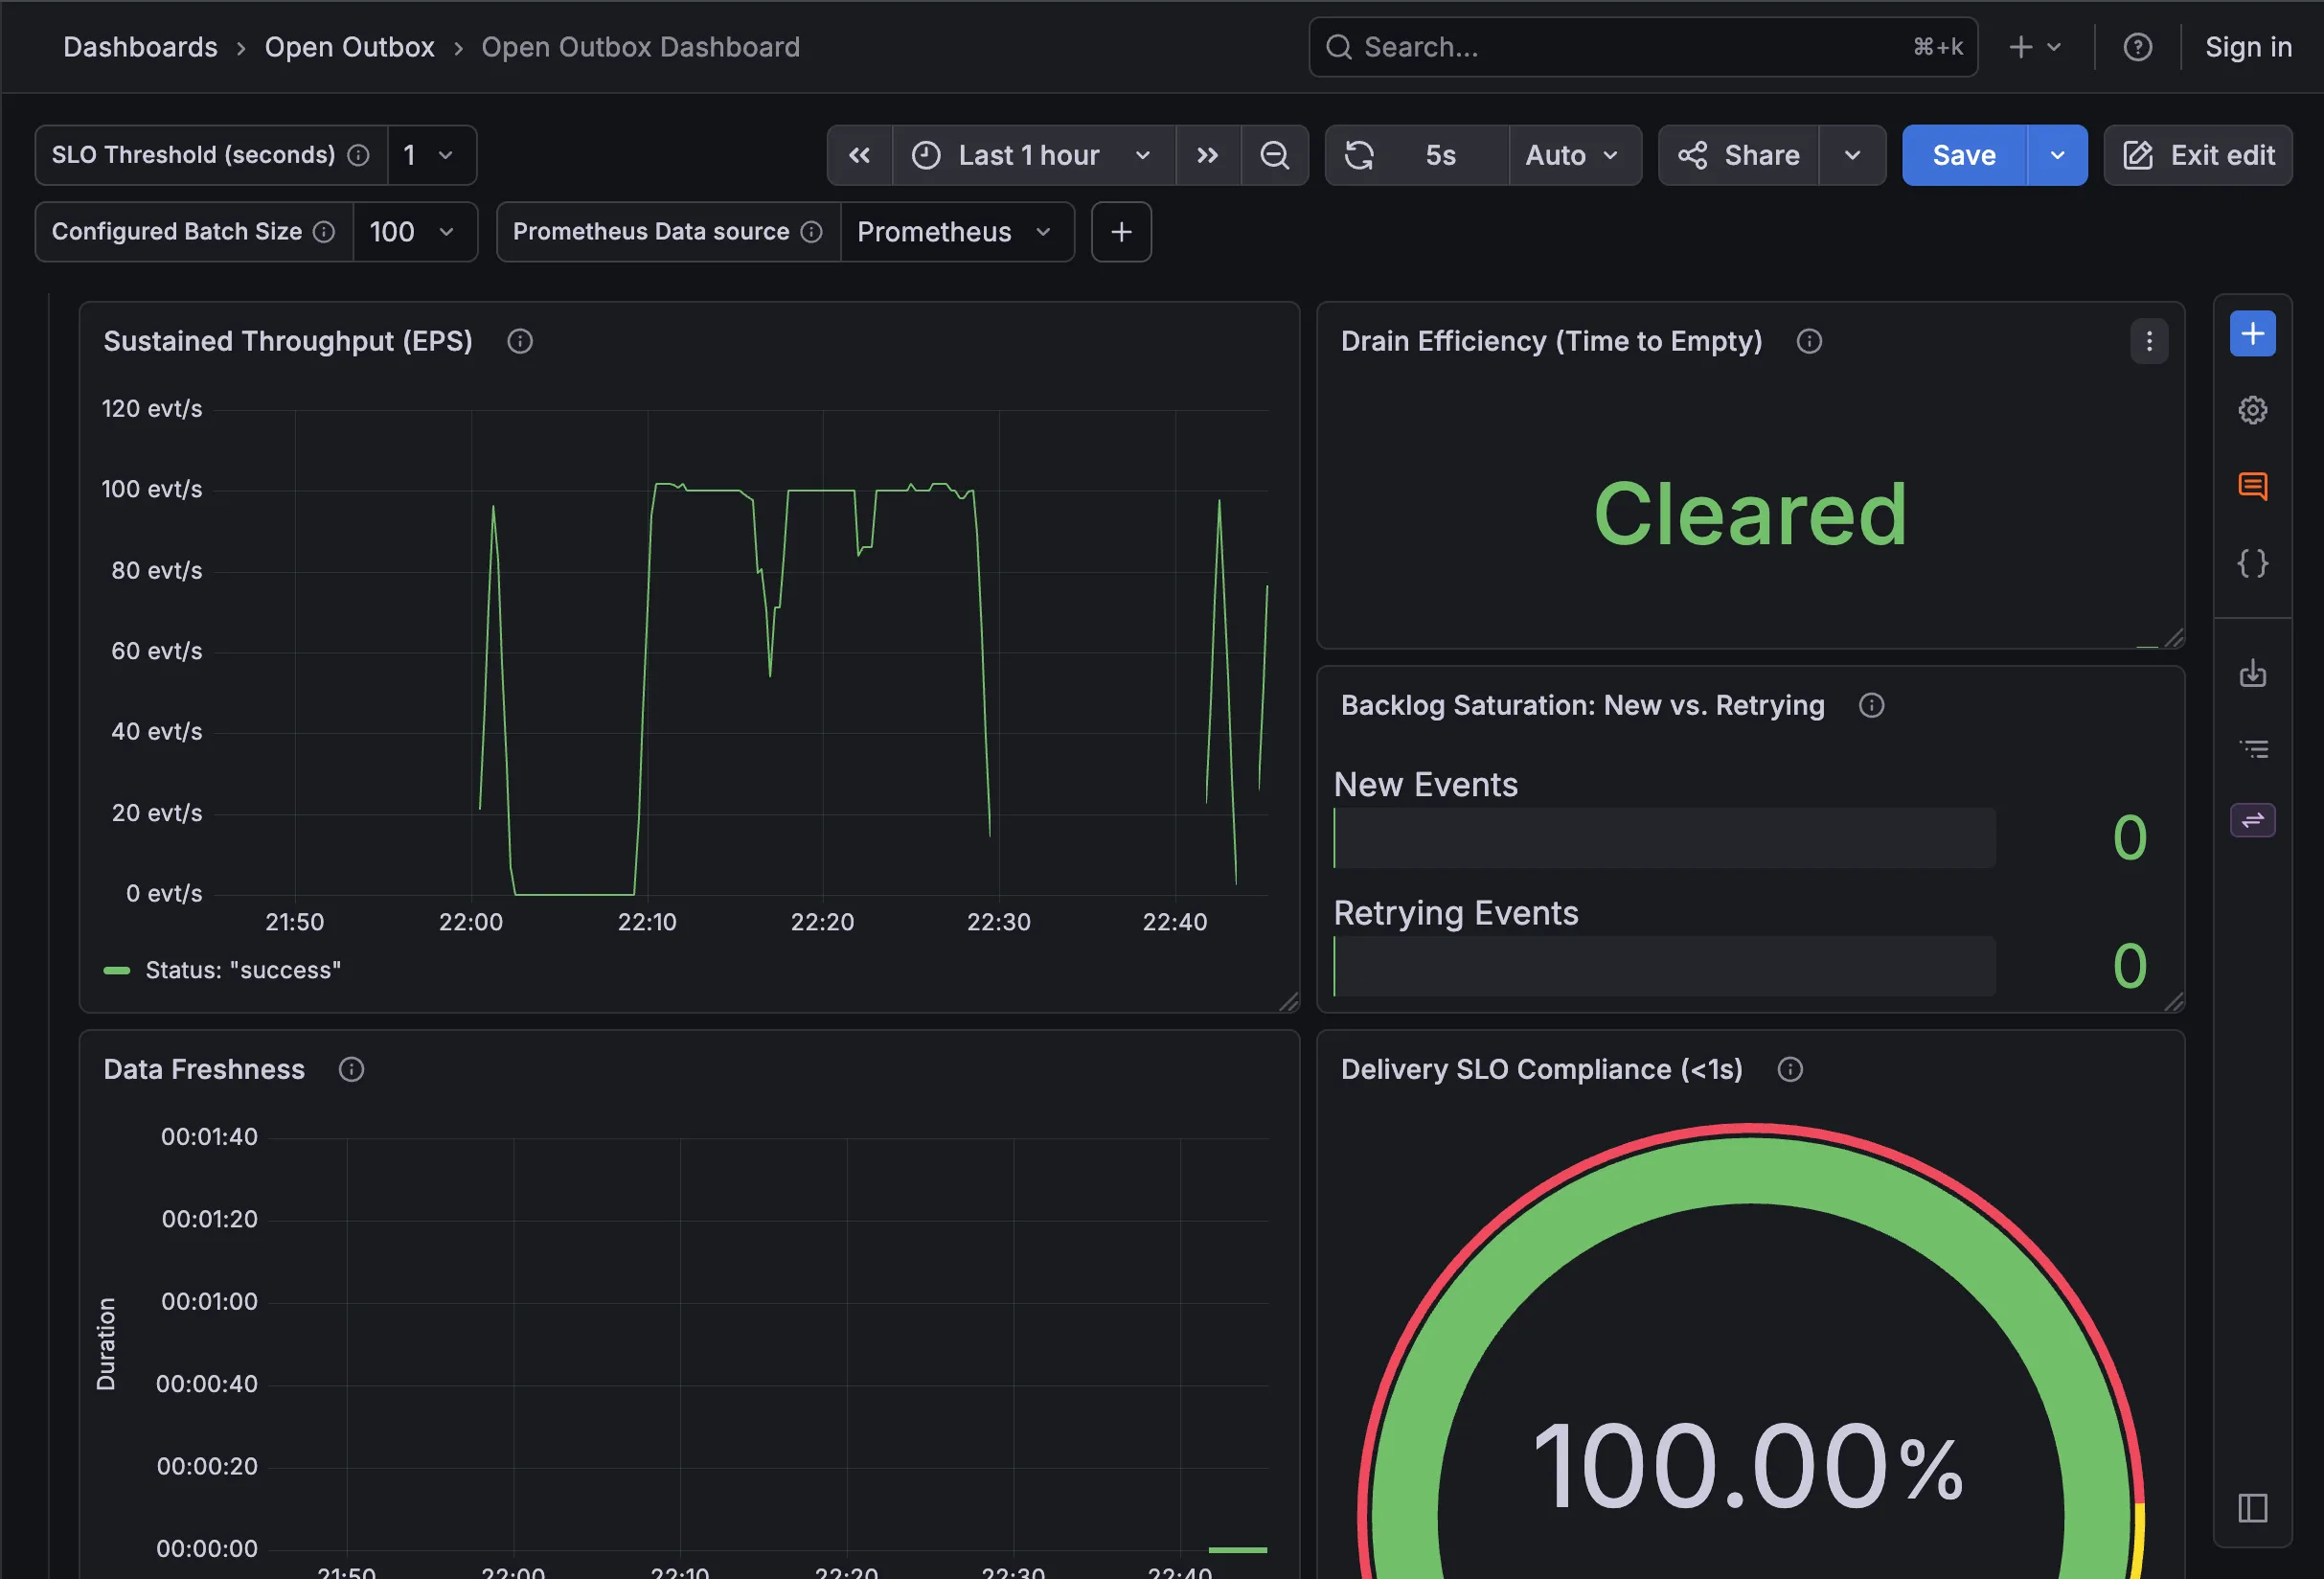
3. Real-time Metrics (Grafana)
Section titled “3. Real-time Metrics (Grafana)”The telemetry suite includes a pre-provisioned Grafana instance mapping native service thresholds out of the box.
- Open http://localhost:3000 in your browser.
- Navigate to the Dashboards section → “Open Outbox” folder.
- Select the “Open Outbox Dashboard”.
This panel provides real-time visualization of your system’s EPS (Events Per Second), Batch Efficiency, and overall SLO compliance. This dashboard configuration matches our official panel hosted on Grafana.com/dashboards/25229.